


3D Column Chart with JavaScript
Cool 3D Column Chart developed in JavaScript/SVG/VML. You dont requiere knowledge in JavaScript or SVG/VML. You can change: Position, width, height, and depth
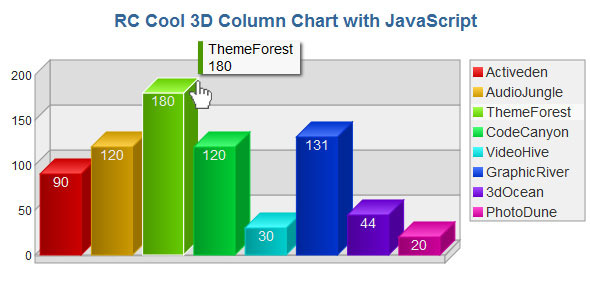
Cool 3D Column Chart developed in JavaScript/SVG/VML.
You dont requiere knowledge in JavaScript or SVG/VML.
You can change:
- Position, width, height, and depth of the Column
- Background colors
- The optional legends attributes
- The optional tooltip background and text-size
- The titles
- You can add more items
This requiere Jquery v 1.3.1+ and Raphael 2.1.1+
JavaScript Charts

Flash Charts


What's Your Reaction?
 Like
0
Like
0
 Dislike
0
Dislike
0
 Love
0
Love
0
 Funny
0
Funny
0
 Angry
0
Angry
0
 Sad
0
Sad
0
 Wow
0
Wow
0